Welcome to the Sales Dashboard project repository! This project focuses on analyzing sales data from a US-based company spanning 2014 to 2017. Through Excel, we've crafted an interactive dashboard that provides comprehensive insights into sales performance across different product categories and states.
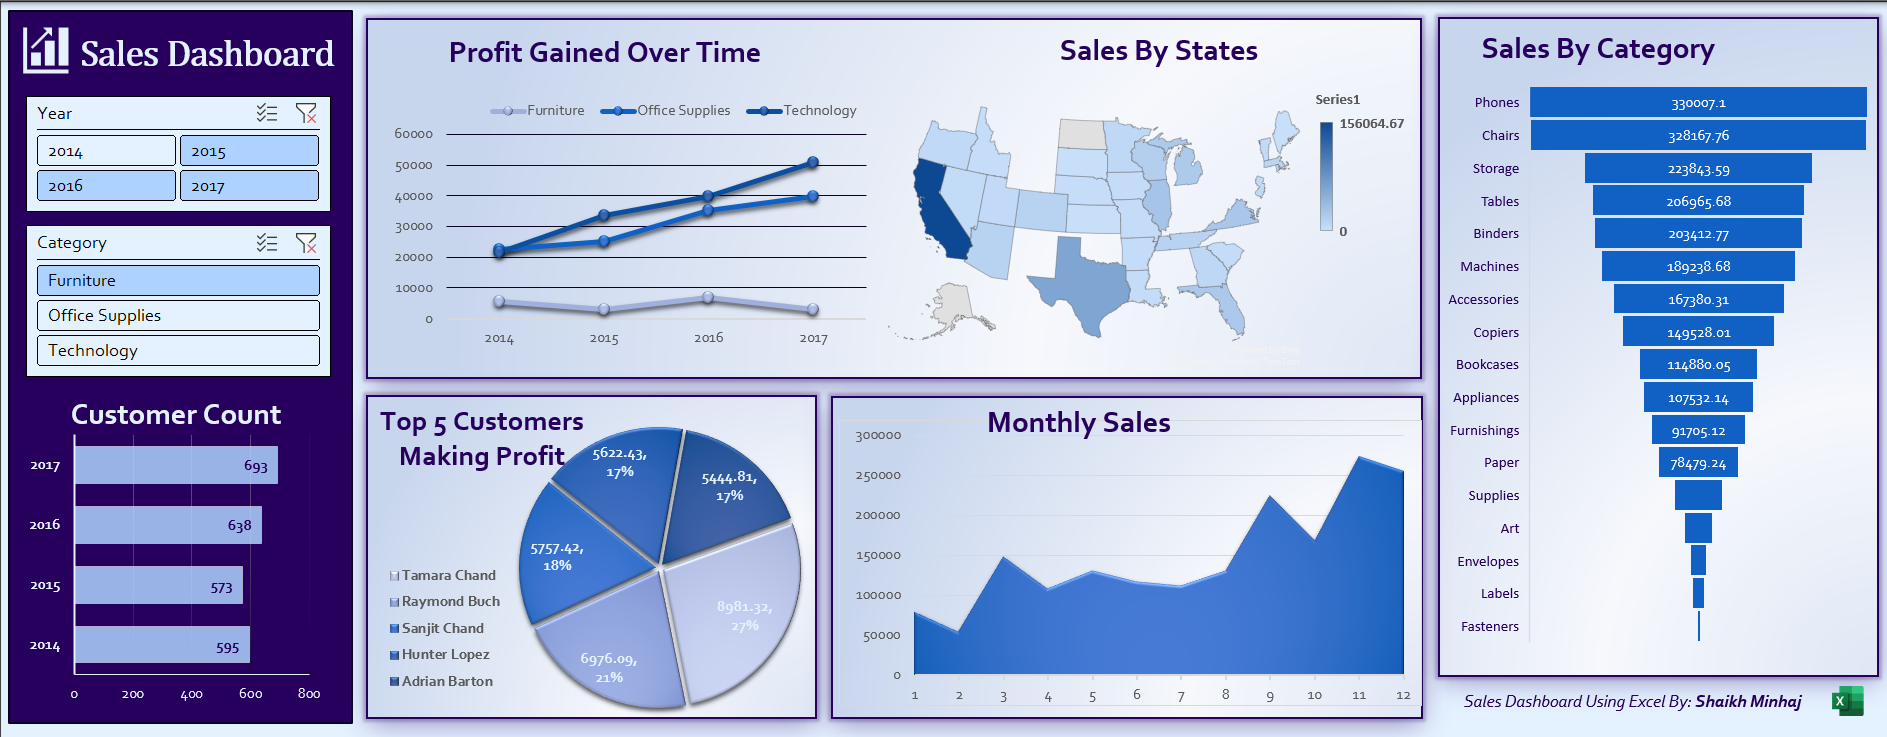
- Analyze sales trends over time
- Visualize sales distribution by state
- Identify top-performing customers
- Dive into monthly sales analysis
- Explore profitability by product category
- Clone this repository to your local machine.
- Open the Excel file
Sales_Dashboard.xlsxto explore the dashboard. - Dive into the
Datafolder to access the raw dataset.
- Objective: To transform raw sales data into actionable insights.
- Tools Used: Microsoft Excel
- Skills Demonstrated: Data analysis, visualization, dashboard design.
Follow me on LinkedIn for more data analysis projects and insights: LinkedIn Profile
#DataAnalysis #DataAnalyst #Excel #DataVisualization #BusinessIntelligence #SalesAnalytics
Explore the power of data analytics and unlock valuable insights with this Sales Dashboard project! Feel free to reach out for any questions or collaborations. Happy analyzing! 🚀